Built on community intelligence.
Designed for measurable improvement.
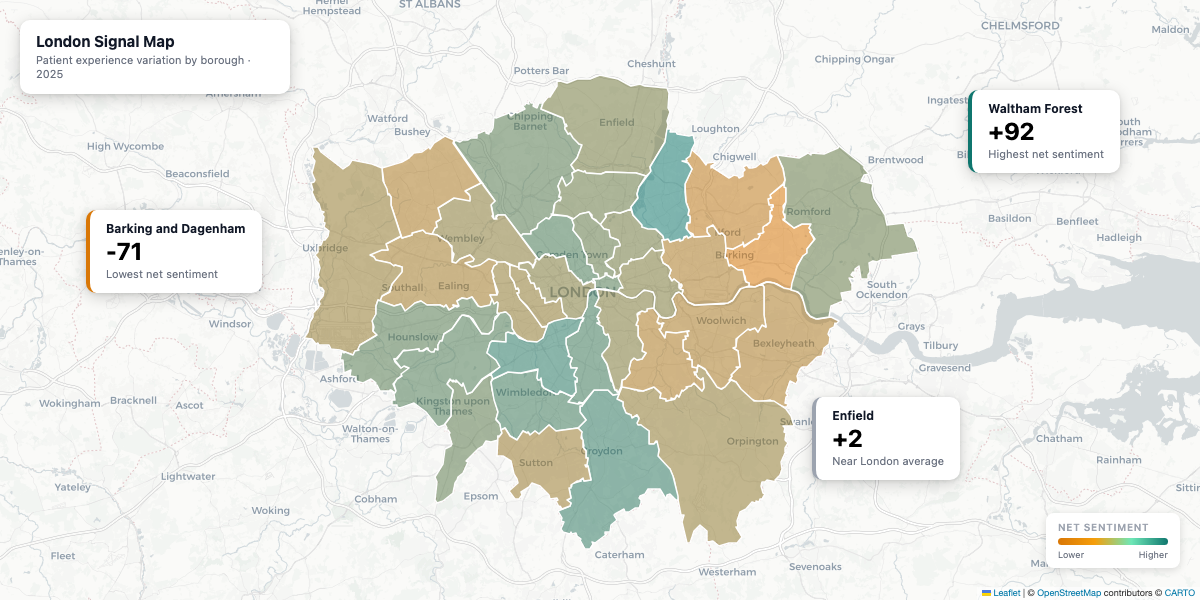
See who's being heard and who isn't
Patient feedback is never representative by default. i4i breaks down experience by ethnicity, deprivation, disability, and place — so you can see the gaps before they widen and evidence them when they do.
Preview the equity view →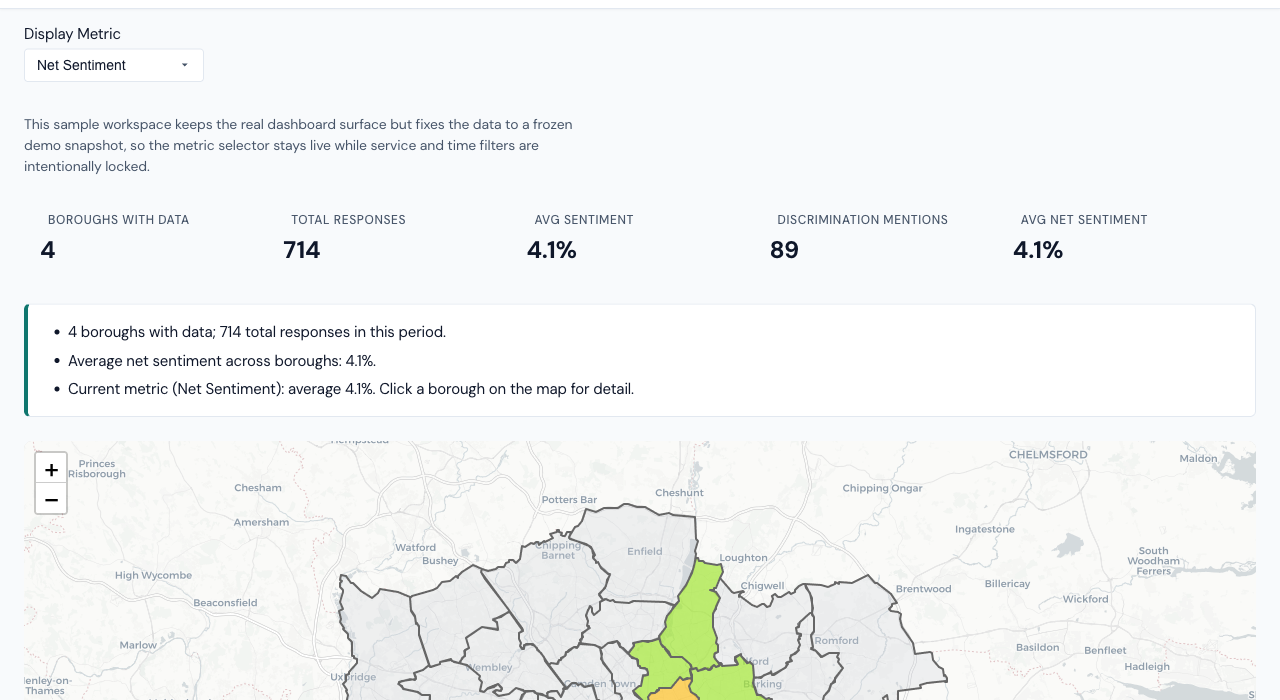
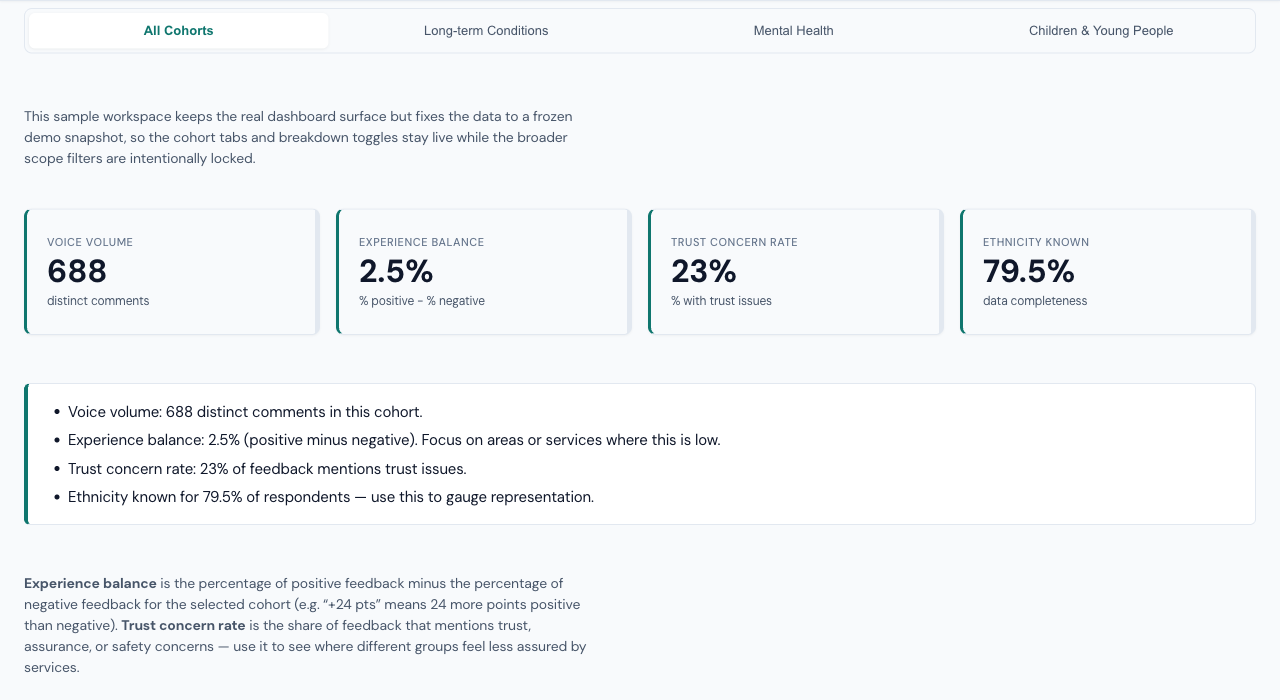
Retain intelligence through restructures, crises, and leadership change
Community insight loses value when it lives in decks, inboxes, and staff memory. i4i keeps a continuous record of signals, themes, and interventions so teams can compare today's picture with prior pressures, transitions, and recovery periods.
Net patient experience · North East London · quarterly · 2018–2025 · n = 127,301
Evidence that survives restructures
Staff leave. Teams reorganise. Priorities shift. But the evidence trail stays: which signals were seen, what was prioritised, what interventions were tried, and what changed. So the next team doesn't start from scratch.
See the evidence trail →Find out what actually works
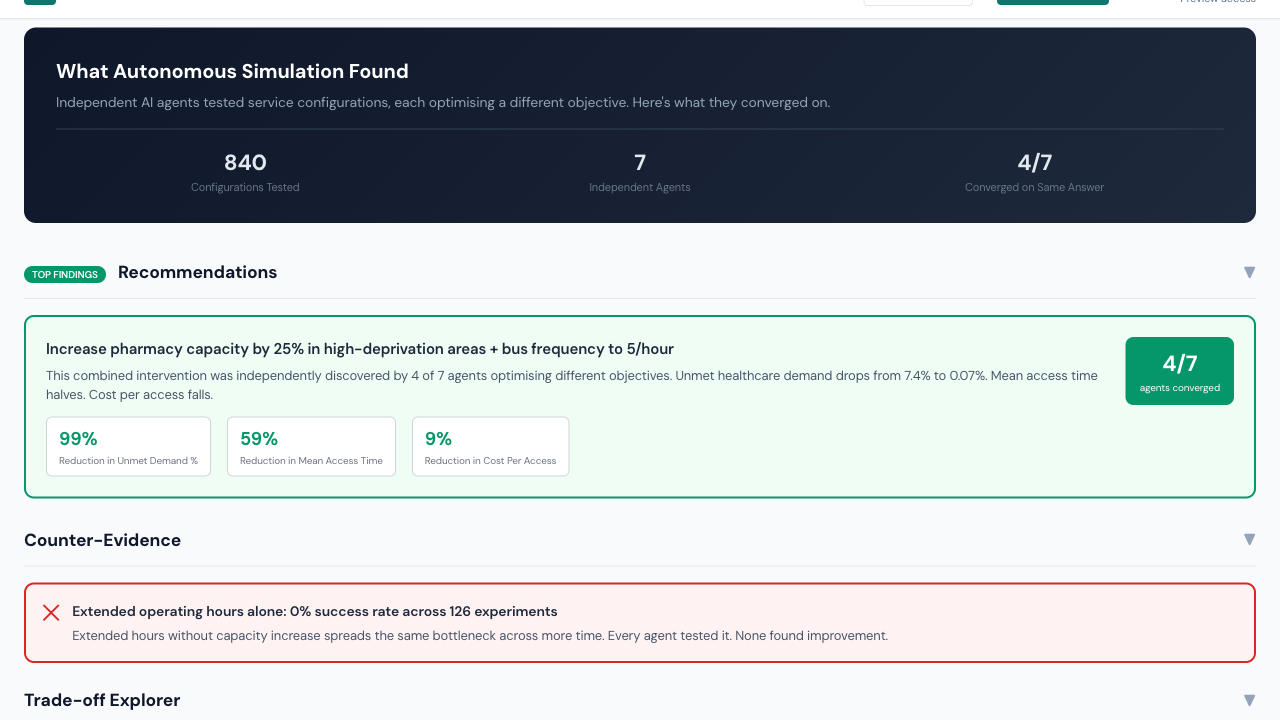
Once you can see the gaps, the question is what closes them. We test hundreds of service configurations against a simulation of your population. When independent approaches converge on the same answer, that's evidence you can take to a board.
Currently deployed in NHS patient experience. The engine works on any structured policy domain.
See simulation results →